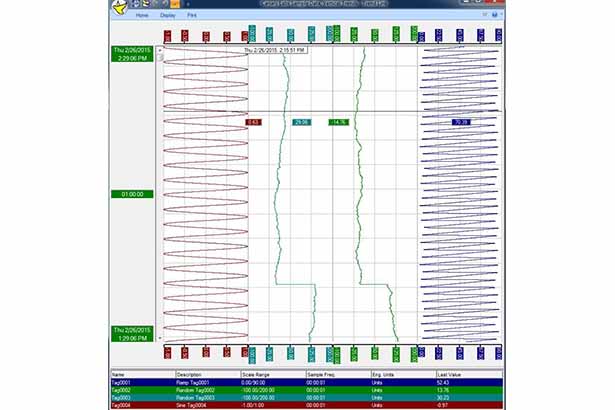
Trend Graph is capable of showing the trends in a vertical orientation scrolling up or down and in a horizontal orientation scrolling to the right or left.
Trend Graph
Trend Graph is capable of showing the trends in a vertical orientation scrolling up or down and in a horizontal orientation scrolling to the right or left.
Legend can be placed at the top or bottom of Trend Graph, resized or turned off for more trend viewing.
Scales are able to show on the live edge, historic edge, both edges or turned off.
Time Display windows can be placed at the top or bottom of Trend Graph, or turned off.
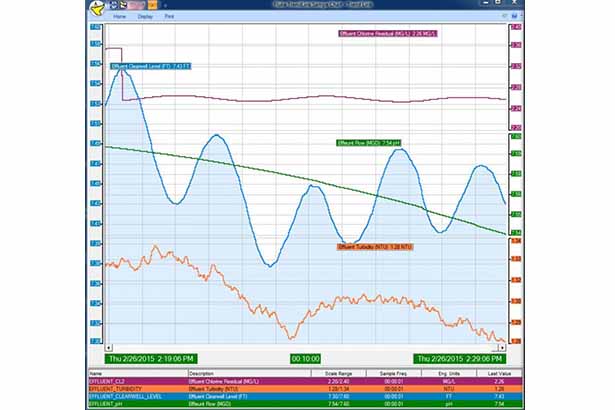
Trends are shown in the Trend Graph window with new data coming in on the live edge and moving across the screen to the historical edge.
Note: There are no limits to the number of trends that can be added to the chart.
Listed below are many of the available features of the Trend Graph:
Value Cursor: A line will appear across the Trend Graph window with value boxes displaying selected information about the Trend where the line and trend intersect.
Autocursor: The AutoCursor displays when the cursor is steady over the Trend Graph window for more than one half second and uses the same settings as the Value Cursor.
Zoom: Zooming is possible ether by editing the time interval of the Time Display window or double clicking of both sides of the area to zoom in on.
Delta: Value boxes display the value at a starting point subtracted from a second point.
Label Position: Labels can be positioned on the screen by dragging.
Auto Scale: Changes the high and low scale values so that the trends are scaled into the band area.
Auto Band: Divides the trend graph window evenly into bands so that each trend is displayed in its own band area.
Full Band: Changes all trends to scale overlayed, top to bottom in place of separate band areas.
Remove Trend(s): Command to remove individual trends or all trends.
Live Mode: To poll or request new data for each trend and scroll to reflect the new data.
Undo/Redo Time: Several levels of undo can be stored and time changes can be grouped or stored on an individual basis.
Grid Lines: User can select grid line properties and determine the time and value intervals.
Features: Manageable feature sets to control operator intervention.
Magnification: Trend line thickness from 1 to 7 pixels.
Mouse Dbl-Click: Selectable for either zooming in or bringing up the right-click context menu.
Trend Features
Each trend has a set of property pages controlling many of its characteristics. Below is a listing of many of these features.
Trend Graph Operation Details
Drawing Method: Weighted Average and Range for smoother or specific drawing.
Description and Engineering Units: Area to change the description and units of a trend.
Precision Formatting: Multiple numbering styles and precision for displayed values.
Hi and Lo Limit: Available hi or lo limit settings for each trend in selectable color.
Limit Lines: Configurable lines to visually display multiple limits. (i.e.: Target, Standard and Critical)
Cache: A buffer control for amount of data stored to memory.
Label: User can select label information and position on the chart.
Legend
A window will appear under or over the Trend Graph window and time displays a header line followed by one status line of the trend color for each trend on the chart. These lines will display certain pieces of information for each trend all of the time.
Legend Operation Details
Resize: The Legend window may be re-sized vertically to display as many of the trend status lines as the user desires.
Drag and Drop: Legend status lines can be rearranged by dragging the status line to the location desired and dropping it there.
Column Headers: Several Legend formatting options are available directly from the Legend column headings
Resizing the Columns: Columns can be resized by dragging.
Header Sorts: Column headings will sort the Legend status lines by the entries in that column.
Line Sort: Sorting from the pop-up menu will sort the Legend status lines in ascending order by the corresponding Legend column or band.
Font: Choice of available font styles, size and effects for the Legend.
Columns: Any of the columns in the Legend window can be turned on or off individually allowing more or less room for the other fields.
Trend Name: This is the name of the trend.
Description: This is the description of the trend.
Scale Range: This is the low and high scale values for the trend.
Sample Freq: The rate at which the trend data was logged.
Eng. Units: This is the engineering units of the trend.
Value Bar: Displays the values under the adjustable bar when turned on.
Last Value: This is the last value in the dataset at the time live mode was interrupted.
Alignment: A convenient way to set column alignments for all columns in the Legend.
Scales
Every trend has a horizontal rectangle in the Trend Graph window in which it is to be displayed. This area is known as the Scale band. The band is defined by an upper and lower boundary. The trend is scaled to the band area by scaling the upper trend scale value to the upper band value and likewise for the lower values.
Scale Operation Details
Enable/Disable: Individual trend scales on either the live edge or historic edge can be turned off.
Tick Marks: The number of graduations displayed for a given Scale can be calculated by Trend Link or by entering a tick mark interval.
Move/Resize: Scale band areas can be moved or resize by dragging the Scale.
In-place Edit: Editing the upper or lower scale limit will rescale the trend to the new limit.
Font: Choice of available font styles, size and effects for the Scales.
Color: Choice of background colors for Scales.
Time Display
The Time Display windows show the interval of time which is visible on the current chart. There are two time displays along the Trend Graph window as well as an interval time showing the difference between the two. In Right-to-Left orientation, the time on the right side of the Trend Graph window is the most recent time being displayed. The time on the left side of the Trend Graph window is an older time than that on the right. Thus the time in the middle is the difference or interval between the two times.
Time Display Operation Details
Scroll Bar: The time range may be scrolled to the left or right which would be into the past or into the future.
Direct Edit: Time range can be set by entering the exact time desired in the time edit boxes.
Font: Choice of available font styles, size and effects for the Time Displays.
Color: Choice of background colors for Time Displays.
Layout: A min/max font size and number of lines to display time.
Millisecond Display: For more precision milliseconds can be turned on.